Visualization through visual imagery has been an effective way to communicate both abstract and concrete ideas since the dawn of humanity. Visualization is any technique for creating images, diagrams, or animations to communicate a message. Visualization today has ever-expanding applications in science, education, engineering (e.g., product visualization), interactive multimedia, medicine, etc. Typical of a visualization application is the field of computer graphics. The invention of computer graphics (and 3D computer graphics) may be the most important development in visualization since the invention of central perspective in the Renaissance period.
Apart from the distinction between interactive visualizations and animation, the most useful categorization is probably between abstract and model-based scientific visualizations. The abstract visualizations show completely conceptual constructs in 2D or 3D. These generated shapes are completely arbitrary. The model-based visualizations either place overlays of data on real or digitally constructed images of reality or make a digital construction of a real object directly from the scientific data.
As a subject in computer science, scientific visualization is the use of interactive, sensory representations, typically visual, of abstract data to reinforce cognition, hypothesis building, and reasoning. Scientific visualization is the transformation, selection, or representation of data from simulations or experiments, with an implicit or explicit geometric structure, to allow the exploration, analysis, and understanding of the data. Scientific visualization focuses and emphasizes the representation of higher order data using primarily graphics and animation techniques. It is a very important part of visualization and maybe the first one, as the visualization of experiments and phenomena is as old as science itself. Traditional areas of scientific visualization are flow visualization, medical visualization, astrophysical visualization, and chemical visualization. There are several different techniques to visualize scientific data, with isosurface reconstruction and direct volume rendering being the more common.
Data visualization is a related of visualization dealing with statistical graphics and geospatial data (as in thematic cartography) that is abstracted in schematic form.
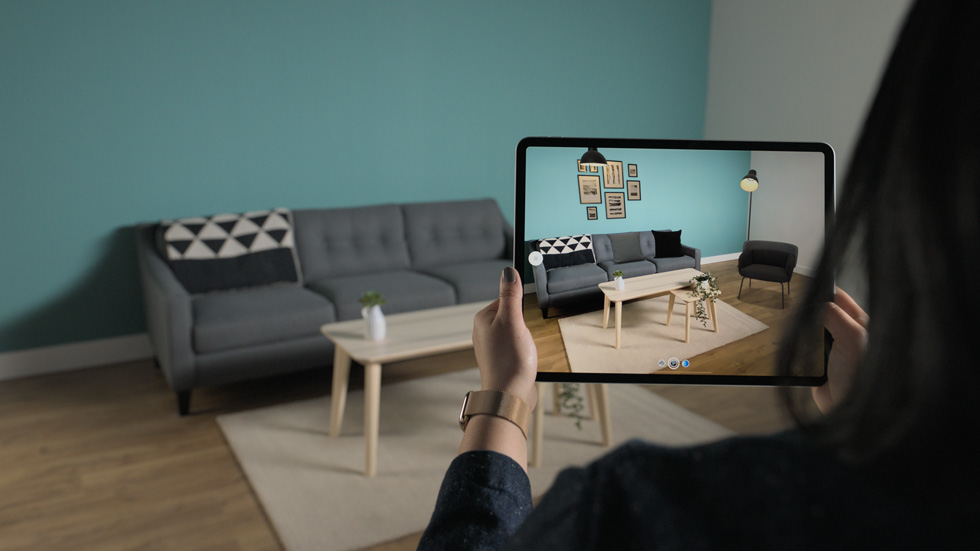
Product visualization involves visualization software technology for the viewing and manipulation of 3D models, technical drawing and other related documentation of manufactured components and large assemblies of products. It is a key part of product life cycle management. Product visualization software typically provides high levels of photorealism so that a product can be viewed before it is actually manufactured. This supports functions ranging from design and styling to sales and marketing. Technical visualization is an important aspect of product development. Originally technical drawings were made by hand, but with the rise of advanced computer graphics the drawing board has been replaced by computer-aided design (CAD). CAD-drawings and models have several advantages over hand-made drawings such as the possibility of 3D modeling, rapid prototyping, and simulation. 3D product visualization promises more interactive experiences for online shoppers, but also challenges retailers to overcome hurdles in the production of 3D content, as large-scale 3D content production can be extremely costly and time-consuming.
3D modeling is the process of developing a mathematical coordinate-based representation of any surface of an object (inanimate or living) in three dimensions via specialized software by manipulating edges, vertices, and polygons in a simulated 3D space.

3D photorealistic effects are often achieved without wire-frame modeling and are sometimes indistinguishable in the final form. Some graphic art software includes filters that can be applied to 2D vector graphics or 2D raster graphics on transparent layers.
Advantages of wire frame 3D modeling over exclusively 2D methods include:
Disadvantages compare to 2D photorealistic rendering may include a software learning curve and difficulty achieving certain photorealistic effects. Some photorealistic effects may be achieved with special rendering filters included in the 3D modeling software. For the best of both worlds, some artists use a combination of 3D modeling followed by editing the 2D computer-rendered images from the 3D model.
In the Using 3D in Visualization scientific research article of Jo Wood, Sabine Kirschenbauer, Jürgen Döllner, Adriano Lopes and Lars Bodum, why we need 3D visualization is well explained as:
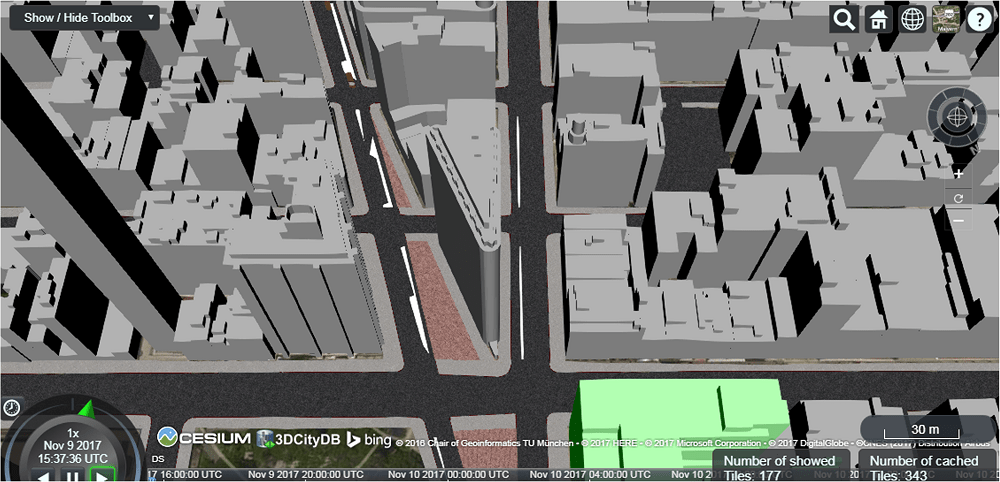
“Historically, one of the drivers behind the use of 3D in visualization has been to adopt processes where there is a simple transformation between the dimensionality of the various stages of the visualization pipeline outlined above. So for example, the widespread use of 3D visualization in architecture and landscape planning can be attributed to a straight forward mapping of 3D data, to 3D assemblies to 3D visual representation. These in turn simplify the activity of visual processing of imagery and the resulting spatial cognition. The only stage in the pipeline where true 3D is not frequently used is in the rendering of the image itself, due largely to the limited availability of true 3D output devices. It is worth commenting though that the construction of physical 3D architectural and planning models remains in widespread practice.
Using 3D in visualization can take advantage of sophisticated strategies and techniques of 3D visual mappings. There are many reasons for this. On the one hand, computer graphics hardware, driven significantly by the gaming industry, advances technologically, and is now delivering low-cost hardware solutions. Based on this kind of hardware, visualization becomes feasible for almost all applications. On the other hand, the 3D graphics industry is developing efficient solutions to most issues of large-scale and dynamic data representations. Techniques such as real-time rendering and multi resolution modelling provide the necessary tools and building blocks to achieve expressive, effective, and appropriate visual mappings.
3D technology also strengthens the application of dynamism in visualization. The advent of high-quality real-time rendering techniques supports interactive exploration and makes interactive animated representations possible. The ability to change 3D viewpoint in real-time is fundamental to creating a sense of virtual realty. The ability to do this has only recently become sufficiently widely available to large numbers of computer users. This opens up new and exciting approaches to visualization. Fast dynamic visualization in 3D also offers the opportunity to represent and explore time-dependent and dynamic data. Most notably, the visualization of temporal process and complex dynamic phenomena can benefit from 3D.”
“The modelling of phenomena using 3D is not new, but it does deserve special treatment when exploring geovisualization issues. This chapter has emphasized the distinction between the dimensionality of referents (real-world phenomena) and their modeled representation. By doing so, it becomes clearer that using 3D in visualization is not limited to data that have three obvious spatial dimensions. Multi-dimensionality should be considered equally part of the modelling, representation and exploration process. More than perhaps any other aspect of visual representation, effective 3D visualization is highly dependent on the rapid developments in the wider field of 3D technologies. This includes hardware, software and theoretical developments in rendering. Those involved with visualization in 3D can benefit from progress in these fields, as well as exert some influence over their future development (for example through collaboration with the gaming industry).”
Source: Visualization (graphics), 3D modeling, Using 3D in Visualization